TradingKey - As of August 31 Eastern Time, Micron (MU) stock rose 2.77% on the day to close at $958.73, reaching an intraday high of $959.78. After a rapid pullback from above $1,250 in late June, Micron's stock price has recently been consolidating mainly in the $800–$1,000 range. The stock is now approaching $1,000 again, showing signs of improvement in its short-term trend.
From a fundamental perspective, Micron remains supported by demand growth for HBM and DRAM driven by AI. In the latest quarter, revenue reached $41.46 billion, with an adjusted gross margin of 84.9%. The company expects next-quarter revenue of around $50 billion and a gross margin of about 86%. Meanwhile, HBM4 has entered volume shipments, and management stated that AI is driving rapid growth in data center memory and storage demand.
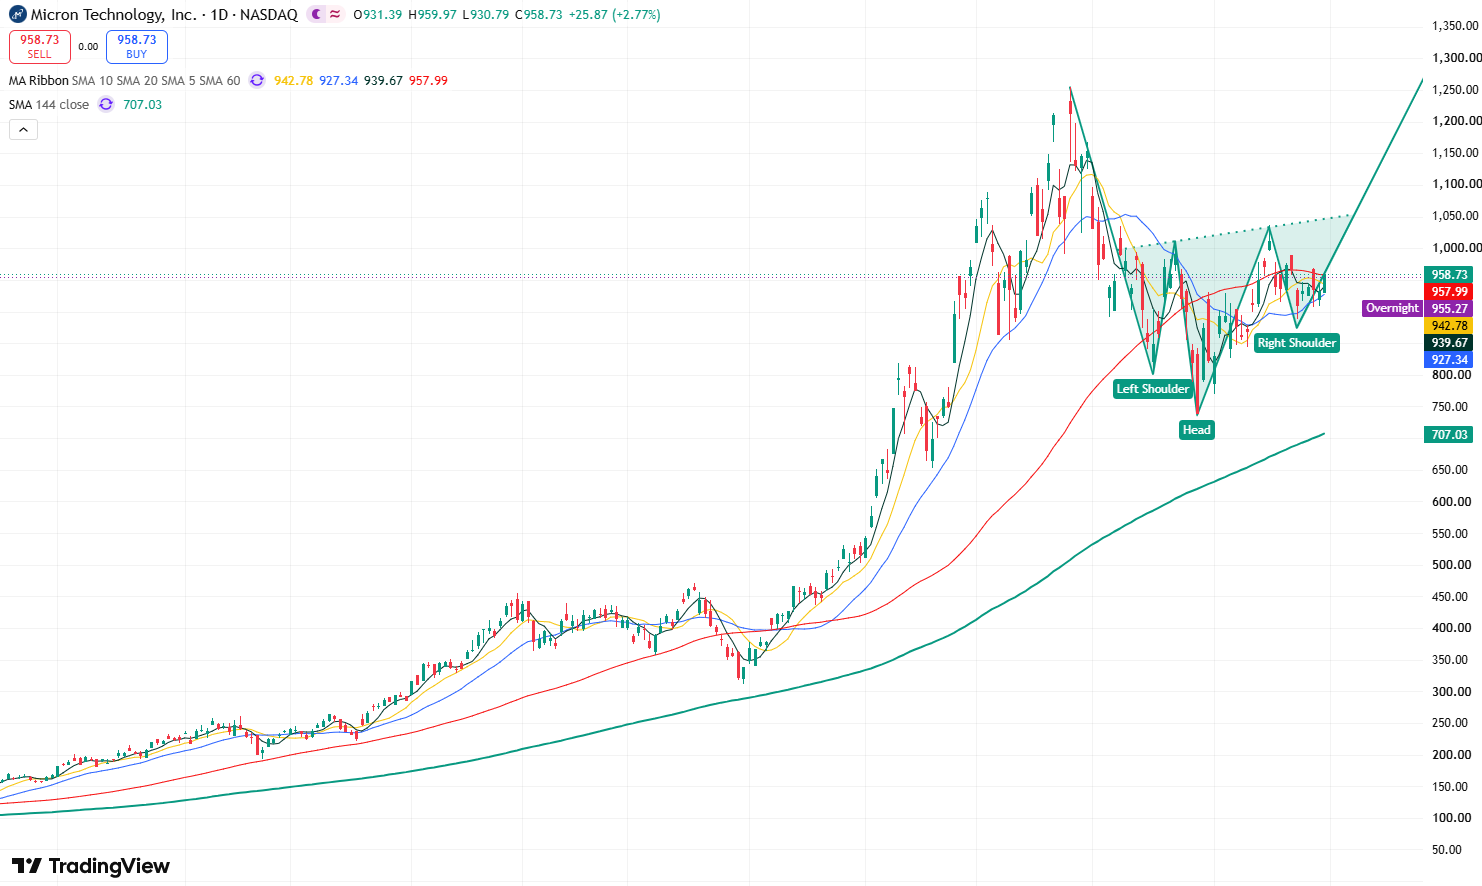
Micron stock daily chart, Source: TradingView
From the daily chart of Micron's stock price, after hitting an all-time high of $1,255 in June, the stock underwent a continuous pullback, dropping to a low of $737.88 before embarking on a sustained rebound. It subsequently formed a potential head-and-shoulders bottom structure, with the left shoulder at $804, the head at $737.88, and the right shoulder forming around $887.
Currently, the formation of the head-and-shoulders bottom structure suggests that short-term bullish momentum in the market will be significantly enhanced. The primary upside target for the stock will be to challenge the recent rebound high of $1,036.13. If it can break through and hold firmly above this level, it will open up upside room toward the previous all-time high of $1,255, and may even set a new record high.
On the downside, the primary support level to watch is near $887. If this level is lost, the stock may further probe down toward around $800. If the decline continues, the stock may test the support at the low of $737.88.
Find out more